กลุ่มชุมชนแลกเปลี่ยนความรู้แบ่งปั่น และช่วยเหลือ ต่อการใช้งาน OpenSource Zabbix เพราะการแบ่งปัน นั้นยิ่งใหญ่กว่า.

TimescaleDB + PostgreSQL + Zabbix Installation on CentOS7 - ความท้าทายด้านประสิทธิภาพที่มากับการเก็บข้อมูลขนาดใหญ่

การติดตั้ง TimescaleDB + PostgreSQL + Zabbix บน CentOS7 - ความท้าทายด้านประสิทธิภาพที่มากับการเก็บข้อมูลขนาดใหญ่
(TimescaleDB + PostgreSQL + Zabbix Installation on CentOS7 - Performance-related challenge with big history and trend data.)

   ได้ยินข่าวมาซักพักแล้ว สำหรับ TimescaleDB (TSDB) ที่นำมาใช้งานกับ Zabbix โดยที่ TimescaleDB คือ เป็นส่วนเสริมของ PostgreSQL (PG) ที่มีการทำงานซึ่งเพิ่มประสิทธิภาพตามอนุกรมเวลาและการเพิ่มประสิทธิภาพการจัดการข้อมูลให้กับ PostgreSQL หรือ อีกนัยนึงก็คือมีการออกแบบมาพิเศษเพื่อให้มีประสิทธิภาพการทำงานสูงสุดสำหรับข้อมูลที่มีเวลามาเกี่ยวข้อง
   (Heard the news for a while for TimescaleDB that is used with Zabbix. TimescaleDB (TSDB) is a PostgreSQL (PG)  extension, which adds time series based performance and data management optimizations to a regular PostgreSQL database. In other words, it is specially designed to provide maximum performance for time series data.)

   ซึ่งใน Zabbix นั้น ตารางในฐานข้อมูลที่เกี่ยวข้องอย่างยิ่งยวดที่เกี่ยวข้องกับเวลาคือ history, history_uint, history_str, history_log, history_text, trends and trends_uint
   (The Zabbix's database tables that related with time series data are history, history_uint, history_str, history_log, history_text, trends and trends_uint.)

   โดย TSDB นั้นจะคล้ายคลึงกับ Table Partitioning (แต่ไม่ได้เหมือนกันทั้งหมด) สำหรับ TSDB จะมีการแบ่งข้อมูลในตารางซึ่งข้อมูลที่แบ่งดังกล่าวจะเรียกว่า chunks ตามที่ได้กำหนดเวลาไว้ว่าในแต่ละอันนั้นคือเวลาช่วงละเท่าใด ซึ่งการแบ่งดังกล่าวจะดำเนินการโดยฐานข้อมูลโดยอัตโนมัติตามช่าวงเวลาที่ได้กำหนดไว้
   (In TSDB is similar to Table Partitioning (but quit difference). TSDB splits this table into so-called chunks in accordance with conditions you specify. This think of chunks as of automatically managed table partitions. Every chunk has an associated time range.)

   ในการทำ Partitioning นั้น โดยทั่วไปใน Zabbix จะมีโพรเซสที่ดำเนินการคือ Housekeeper ทำจะมี batch กำเนินการทำ partitioning ของข้อมูล เพื่อแยกข้อมูลตามช่วงเวลาที่ได้กำหนดไว้ ซึ่งในช่วงเวลาที่ housekeeper ทำการ partitioning นั้น เมื่อมีการ insert/update/delete ในช่วงเวลาดังกล่าวโดย database syncer ก็อาจเกิดการ lock ตามการทำงานของ database อีกทั้งถ้าข้อมูลมีขนาดใหญ่ ก็ยิ่งทำให้การทำงานดังกล่าวยิ่งช้าลง
   (In partitioning process, the Zabbix has batch process named "Housekeeper" that partitioning the table by time condition. Then when the database transaction such as insert/update/delete to perform operation via database synced, it may cause of database lock. In case of big table data, it have more longer process time.)

   ข้อได้เปรียบของการใช้งาน TSDB ที่สำคัญหนึ่งในหลายๆ ข้อ คือ จะช่วยเพิ่มประสิทธิภาพของ history syncer และ housekeeper
   (The one of manybenefit of TSDB is it brings considerable performance improvements for Zabbix history syncer and housekeeper.)


ขั้นตอนการติดตั้ง Zabbix 4.2 + PostgreSQL 11 + TimescaleDB 1.3 บน CentOS 7 (แถมการติดตั้ง PHP 7.2)
(Step for install Zabbix 4.2 + PostgreSQL 11 + TimescaleDB 1.3 on CentOS 7 plus PHP 7.2)

1. Install required yum related package.
   # yum install yum-utils


2. Preparing for PHP 7.2 installation (The PHP 7.2 will be installing with Zabbix frontend installation step.)
   # yum install epel-release
   # yum-config-manager --enable remi-php72

------ PostgreSQL and TimescaleDB Section ------
3. Preparing for PostgreSQL and TimescaleDB installation
   # yum install -y https://download.postgresql.org/pub/repos/yum/11/redhat/rhel-7-x86_64/pgdg-redhat-repo-latest.noarch.rpm
 
   - Add following line into file named /etc/yum.repos.d/CentOS-Base.repo, [base] and [updates] sections
      exclude=postgresql*

   - Add TimescaleDB's third party repository and install TimescaleDB, which will download any dependencies it needs from the PostgreSQL repo
   # cat > /etc/yum.repos.d/timescale_timescaledb.repo <<EOL
[timescale_timescaledb]
name=timescale_timescaledb
baseurl=https://packagecloud.io/timescale/timescaledb/el/7/\$basearch
repo_gpgcheck=1
gpgcheck=0
enabled=1
gpgkey=https://packagecloud.io/timescale/timescaledb/gpgkey
sslverify=1
sslcacert=/etc/pki/tls/certs/ca-bundle.crt
metadata_expire=300
EOL

   # yum update


4. Installing PostgreSQL + TimescaleDB
   # yum install timescaledb-postgresql-11


5. Setting PG data directory to other location (other disk/partition for increasing performance and reliability management) e.g. target directory named is /data/pgsql

   - Create target directory
   # mkdir -p /data/pgsql
   # chown -R postgres:postgres /data/pgsql

   - Setting target directory in daemon
   # systemctl edit postgresql-10.service
      [Service]
      Environment=PGDATA=/data/pgsql/11/data

   - Crosscheck this file will be created
   # cat /etc/systemd/system/postgresql-11.service.d/override.conf
      [Service]
      Environment=PGDATA=/data/pgsql/11/data

   - Reload this setting
   # systemctl daemon-reload


6. Initial PostgreSQL database
    # /usr/pgsql-11/bin/postgresql-11-setup initdb
      Initializing database ... OK


7. Tuning databs
   # timescaledb-tune --pg-config=/usr/pgsql-11/bin/pg_config --conf-path=/data/pgsql/11/data/postgresql.conf
   Using postgresql.conf at this path:
      /data/pgsql/11/data/postgresql.conf

   --> Answer yes for all questions.


8. Enable and Start PostgreSQL database
   # systemctl enable postgresql-11
   # systemctl start postgresql-11
   # systemctl status postgresql-11


------ Zabbix Section ------
9. Preparing for Zabbix installation
   # rpm -ivh https://repo.zabbix.com/zabbix/4.2/rhel/7/x86_64/zabbix-release-4.2-1.el7.noarch.rpm
   # yum-config-manager --enable rhel-7-server-optional-rpms
   # yum update


10. Installing Zabbix server
   # yum install zabbix-server-pgsql


11. Installing Zabbix frontend (PHP 7.2 will be installing with this step)
   # yum install zabbix-web-pgsql


12. Database preparation
   - Create PG database user name zabbixdbusr
   # sudo -u postgres createuser --pwprompt zabbixdbusr

   - Create database in PG named zabbix
   # sudo -u postgres createdb -O zabbixdbusr -E Unicode -T template0 zabbix

   - Import schema to database
   # zcat /usr/share/doc/zabbix-server-pgsql*/create.sql.gz | sudo -u zabbixdbusr psql zabbix

   - Enable TimescaleDB extension for zabbix database
   # echo "CREATE EXTENSION IF NOT EXISTS timescaledb CASCADE;" | sudo -u postgres psql zabbix

   - Create TimescaleDB related table (Hypertable)
   # zcat /usr/share/doc/zabbix-server-pgsql*/timescaledb.sql.gz | sudo -u zabbixdbusr psql zabbix


13. Setting database credentials to related configuration
   # vi /etc/zabbix/zabbix_server.conf
      DBHost=127.0.0.1
      DBName=zabbix
      DBUser=zabbixdbusr
      DBPassword=<password>


14. Setting PG authentication
   # vi /data/pgsql/11/data/pg_hba.conf
      host zabbix zabbixdbusr 127.0.0.1/32 password


15. Restarting PostgreSQL for reloading above configuration
   # systemctl stop postgresql-11
   # systemctl start postgresql-11
   # systemctl status postgresql-11


16. Enable and Start Zabbix server
   # systemctl enable zabbix-server
   # systemctl start zabbix-server
   # systemctl status zabbix-server


17. Setting PHP configuration that requires Zabbix
   # vi /etc/php.ini
   max_execution_time 300
   memory_limit 128M
   post_max_size 16M
   upload_max_filesize 2M
   max_input_time 300
   max_input_vars 10000
   #always_populate_raw_post_data -1
   date.timezone Asia/Bangkok


18. Enable and Start HTPD web server
   # systemctl enable httpd
   # systemctl start httpd
   #systemctl status httpd


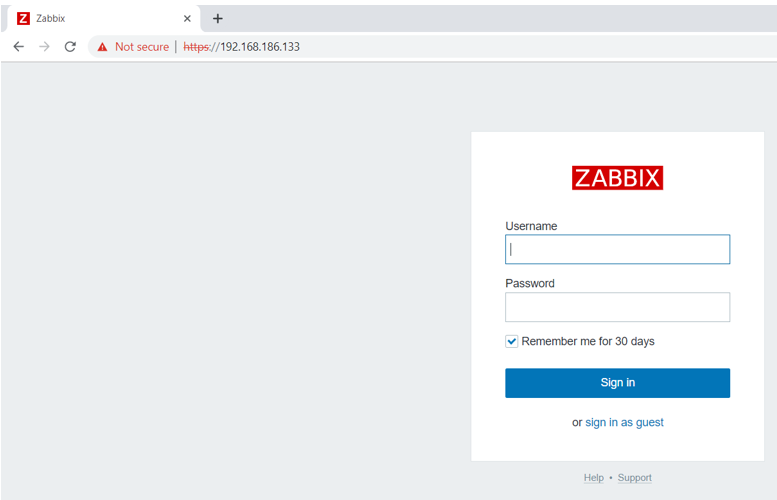
19. Goto URL http://YOURZABBIXIP/zabbix for completing frontend installation and following installed step.
   Database type: PostgreSQL
   Database host: 127.0.0.1
   Database port: 5432
   Database name: zabbix
   User: zabbixdbusr
   Password: <password>


*** Please considering SELinux ***

Reference:
[1] https://blog.zabbix.com/zabbix-time-series-data-and-timescaledb/6642/
[2] https://www.zabbix.com/documentation/4.2/manual/installation
[3] https://docs.timescale.com/v1.3/getting-started/installation/rhel-centos/installation-yum

Share:

ประมวลภาพงานอบรม Zabbix training for beginners ครั้งที่ 3

ประมวลภาพงานอบรม Zabbix training for beginners ครั้งที่ 3
@Too Fast To Sleep at KU
12,19 May 2019
by Zabbix in Thailand


Share:

Enable https บน Apache ด้วย self signed certificate

สวัสดีครับ ผมขอเกริ่นก่อนว่า HTTPS คืออะไร
HTTPS (Hypertext Transfer Protocol Secure) คือโปรโตคอลการสื่อสารอินเทอร์เน็ตที่ช่วยรักษาความสมบูรณ์ถูกต้องของข้อมูลผู้ใช้และเก็บข้อมูลไว้เป็นความลับระหว่างคอมพิวเตอร์ของผู้ใช้กับเว็บไซต์ ผู้ใช้คาดหวังประสบการณ์ออนไลน์ที่มีความปลอดภัยและเป็นส่วนตัวระหว่างที่ใช้เว็บไซต์ เราขอแนะนำให้คุณใช้ HTTPS เพื่อปกป้องการเชื่อมต่อของผู้ใช้กับเว็บไซต์ ไม่ว่าเนื้อหาในเว็บไซต์จะเป็นรูปแบบใดก็ตาม
สามารถอ่านต่อได้ที่ https://support.google.com/webmasters/answer/6073543?hl=th

ซึ่งหลังจากที่เราได้ติดตั้ง Zabbix ไปแล้วทุกท่านจะทราบว่า Zabbix จะวิ่งด้วย http ซึ่งถ้าเราจะเปิดให้เข้าจาก public ได้เราควร enable https ก่อนครับ เรามาดูกันดีกว่า ว่าเราจะสามารถ enable HTTPS บน Zabbix ของเราได้อย่างไร
อย่างแรกต้องเข้าใจก่อนว่า Zabbix ของเราใช้ web service ของอะไร ในที่นี้ของผมใช้ Apache ครับ

1) Login ด้วย root
# su root

2) เราจะติดตั้ง service เพิ่ม mod_ssl เพิ่มเติมก่อนครับ
[root@localhost ~]# yum install -y mod_ssl

3) สร้าง folder สำหรับ เก็บ private key
[root@localhost ~]# mkdir /etc/ssl/private

4) เปลี่ยน permission ให้ user root สามารถเข้าถึง folder ได้อย่างเดียว
[root@localhost ~]# chmod 700 /etc/ssl/private

5) ต่อไปเราจะ Generate cert ของเรา ถ้าอยากปรับ parameter สามารถดูข้อมูลตามข้างล่างได้ครับ
[root@localhost ~]# openssl req -x509 -nodes -days 365 -newkey rsa:2048 -keyout /etc/ssl/private/apache-selfsigned.key -out /etc/ssl/certs/apache-selfsigned.crt

Country Name: ชื่อย่อที่ตั้งประเทศ ขององค์กรเจ้าของโดเมนที่จดทะเบียนถูกต้องตามกฎหมาย กรณีประเทศไทยใช้ TH
State or Province Name: ชื่อที่ตั้งจังหวัด ขององค์กรเจ้าของโดเมนที่จดทะเบียนถูกต้องตามกฎหมาย
Locality Name: ชื่อเขต อำเภอ ขององค์กรเจ้าของโดเมนที่จดทะเบียนถูกต้องตามกฎหมาย
Organization Name: ชื่อองค์กรเจ้าของโดเมนที่จดทะเบียนถูกต้องตามกฎหมาย
Organizational Unit Name: ชื่อหน่วยงานที่รับผิดชอบ เช่น IT Common name: ชื่อโดเมนจริงที่ต้องการใช้งาน SSL
E-mail Address: ใส่ email account ของผู้ดูแล SSL ของเจ้าของโดเมน


6) ต่อไปเราจะมาสร้าง Diffie-Hellman group จาก PFS (อาจจะใช้เวลามากหน่อยครับ)
[root@localhost ~]# openssl dhparam -out /etc/ssl/certs/dhparam.pem 2048

7) ซึ่งตอนแรก apache-selfsigned.crt จะยังไม่มี Parameter เราจะใช้คำสั่งทางด้านล่างเพื่อ Copy ข้อมูลไปต่อท้าย
[root@localhost ~]# cat /etc/ssl/certs/dhparam.pem | sudo tee -a /etc/ssl/certs/apache-selfsigned.crt

8) เราจะทำการแก้ไข ssl.conf ตามด้านล่างนี้ครับ
[root@localhost ~]# nano /etc/httpd/conf.d/ssl.conf

9) แก้ไขข้อมูลตามด้านล่างนี้ครับ

<VirtualHost _default_:443>
DocumentRoot "/usr/share/zabbix"                #(DocumentRoot ผมแก้ไขให้ index ไปเรียก Path ของ Zabbix)
ServerName zabbix.local:443


#   SSL Protocol support:
# List the enable protocol levels with which clients will be able to
# connect.  Disable SSLv2 access by default:
SSLProtocol all -SSLv2

#   SSL Cipher Suite:
#   List the ciphers that the client is permitted to negotiate.

#   See the mod_ssl documentation for a complete list.
SSLCipherSuite HIGH:MEDIUM:!aNULL:!MD5:!SEED:!IDEA


#   Server Certificate:
# Point SSLCertificateFile at a PEM encoded certificate.  If
# the certificate is encrypted, then you will be prompted for a
# pass phrase.  Note that a kill -HUP will prompt again.  A new
# certificate can be generated using the genkey(1) command.
SSLCertificateFile /etc/ssl/certs/apache-selfsigned.crt

#   Server Certificate:
# Point SSLCertificateFile at a PEM encoded certificate.  If
# the certificate is encrypted, then you will be prompted for a
# pass phrase.  Note that a kill -HUP will prompt again.  A new

# certificate can be generated using the genkey(1) command.
SSLCertificateKeyFile /etc/ssl/private/apache-selfsigned.key


10) Copy text ด้านล่างนี้ไปวางหลัง </VirtualHost>

</VirtualHost>

# Begin copied text
# from https://cipherli.st/
# and https://raymii.org/s/tutorials/Strong_SSL_Security_On_Apache2.html
SSLCipherSuite EECDH+AESGCM:EDH+AESGCM:AES256+EECDH:AES256+EDH
SSLProtocol All -SSLv2 -SSLv3
SSLHonorCipherOrder On
# Disable preloading HSTS for now.  You can use the commented out header line that includes
# the "preload" directive if you understand the implications.
#Header always set Strict-Transport-Security "max-age=63072000; includeSubdomains; preload"
Header always set Strict-Transport-Security "max-age=63072000; includeSubdomains"
Header always set X-Frame-Options DENY
Header always set X-Content-Type-Options nosniff
# Requires Apache >= 2.4
SSLCompression off 
SSLUseStapling on 
SSLStaplingCache "shmcb:logs/stapling-cache(150000)" 
# Requires Apache >= 2.4.11
# SSLSessionTickets Off


11) ต่อไปเราจะมี redirect http ไปเป็น https ให้ Copy ข้อความทางด้านบ่างแล้วนำไปแก้เป็น IP Zabbix ของท่าน

[root@localhost ~]# nano /etc/httpd/conf.d/non-ssl.conf

<VirtualHost *:80>
        ServerName 192.168.186.133
        Redirect "/" "https://192.168.186.133/"
</VirtualHost>


12) ให้เราทำการเทส config จาก Apache ครับ จะต้องมีคำว่า
Syntax OK

13) restart service Apache
[root@localhost ~]# systemctl restart httpd

14) ลองเข้า Server zabbix ของเราเป็น http จะกลายเป็น https ครับ


Share:

การตรวจสอบการทำงานผ่านพอร์ทให้บริการของเซอร์วิสโดยไม่ต้องใช้ Zabbix Agent (Monitoring everything service ports with agent less)

   ในการตรวจสอบการทำงาน (Monitoring) บนระบบ Production ในหลายๆ ครั้งนั้น สิ่งที่ผู้ดูแลระบบมักจะกลัว และไม่ค่อยมักจะอยากให้ทำบนระบบคือ การติดตั้งโปรแกรมใดๆ ลงบนเครื่องนั้น โดยเฉพาะกับเครื่องที่มีการทำงานโหลดสูงๆ (High utilization) มีการทำงานที่สำคัญ (Critical function) รวมไปถึงขอปิดระบบยากๆ  (Less down time)

   ดังนั้นทางเลือกหนึ่งที่จะสามารถทำการตรวจสอบการทำงานเกี่ยวกับการให้บริการแต่ละเซอร์วิสผ่านทางพอร์ท (Port) ได้ คือการ connect เข้าไปผ่านช่องทางของพอร์ทการทำงานในเซอร์วิสเหล่านั้น

   ข้อดี:

  1. ไม่ต้องติดตั้งโปรแกรมใดๆ ลงบนเครื่องนั้นๆ ใช้ช่องทางปกติที่เซอร์วิสนั้นเปิดให้บริการอยู่แล้ว
  2. สามารถทำงานได้เกือบเทียบเท่า Agent โดยสามารถทำได้เท่าที่พอร์ทนั้นให้บริการ
  3. เวลาระบบมีปัญหา เราจะไม่เป็น แพะ!!!
   ข้อเสีย:
  1. อาจจะทำงานได้ไม่เทียบเท่ากับการติดตั้ง Agent ในบางกรณีที่รันบางคำสั่งไม่สามารถใช้งานผ่านพอร์ทนั้นได้
  2. ต้องเขียนโปรแกรมนึดนึง
  3. อาจจะมีการติดตั้งบาง Module บน Zabbix Server(Proxy) ในกรณีที่เป็นเซอร์วิสแปลกๆ

   สิ่งที่ต้องเตรียม
  • การกำหนด Zabbix Item, Macro และ External Script
  • การเขียนโปรแกรม (Python, Shell Script)

   ทำความรู้จักกับ Zabbix Item
      สำหรับ Item ใน Zabbix นั้น คือการสร้างการ monitor หนึ่งอย่าง เช่นต้องการสร้างการ monitor ระบบ MSSQL เราสามารถสร้าง Item ที่ Host ได้ดังนี้ (ปกติควรสร้าง Item ที่ Template แต่เพื่อความเข้าใจที่ง่าน และลดขั้นตอน จึงของแสดงตัวอย่างในการสร้าง Item ที่ Host)

Configuration -> Hosts -> Items -> Create item

โดยจะปรากฏหน้าจอ Create item  โดยใส่ข้อมูลดังนี้
  • Name: MSSQL_mon  => คือชื่อของ Item นี้
  • Type: External check  => คือการเลือกรูปแบบในการตรวจสอบ ในที่นี้เลือก External check เพื่อให้ Zabbix ใช้ script ที่เราจะสร้างขึ้นในขั้นตอนต่อไปมาใช้งาน
  • *Key: mssqlchk.py["{HOST.CONN}","{DBQUERY}","{DBUSER}","{DBPASS}","{DBNAME}"]  => คือการกำหนด script ที่จะใช้งานในการตรวจสอบ โดยมีพารามิเตอร์ภายใน [] ซึ่งพารามิเตอร์นั้นจะใช้การนำ Macro มาใช้งานเพื่อความสะดวกในการกำหนดค่าปรับแต่ง (Configuration)
    • รูปแบบของ script คือ scriptname[<parameter1>,<parameter2>,...]  => โดยที่ script อยู่ที่ /etc/zabbix/externalscripts ใน Zabbix Server/Proxy
    • *Macro คือสิ่งที่เปรียนเสมือนตัวแปรที่สามารถกำหนดได้ในระบบ Zabbix ซึ่งมี macro อยู่สามแบบคือ System (supported) macro, Function macro และ User macro (ดูรายละเอียดเพิ่มเติมที่ https://www.zabbix.com/documentation/4.0/manual/config/macros)
  • Host interface: IPADDR  => คือหมายเลขไอพีของเครื่องที่จะต้องการตรวจสอบการทำงาน
  • Type of information: Numeric (float)  => คือชนิดข้อมูลที่จะต้องการเก็บ กำหนดเป็น Numeric (float) คือทศนิยม ที่เป็นได้ทั้งค่าบวก และลบ (พิจารณาสิ่งที่ script ได้ return ผลมา ณ ที่นี้คือ เวลา response time  เป็นวินาที)
  • Units: s  => คือหน่วยของค่าที่ต้องการกำหนดของ Item นี้ เช่น ms คือ มิลลิวินาที
  • Update interval: 300s  => คือเวลาทุกๆ ที่ต้องการให้ตรวจสอบ Item นี้ เช่น 300s คือ 300 วินาที
  • History storage period: 90d  => คือระยะเวลาที่ให้ระบบเก็บค่าทุกๆ ครั้งที่มีการตรวจสอบ Item นี้ เช่น 90d คือ 90 วัน
  • Trend storage period: 365d  => คือระยะเวลาที่ให้ระบบเก็บค่าที่ถูกประมวลผลแล้วเช่น Min,Max,Avg
  • Show value: As is  =>  คือรูปแบบการเก็บค่า Item สำหรับ As is คือได้ค่ามายังไงก็เก็บค่านั้น


   ทำความรู้จักกับ Macro
      สำหรับ Macro ใน Zabbix นั้นคือตัวแปรที่สามารถเก็บค่าต่างๆ ได้ ซึ่ง macro นั้นมี 3 รุปแบบคือ
  1. System (supported) macro คือ macro ของระบบเช่น หมายเลขไอพีของ host นั้น
  2. Function macro คือการกำหนด macro ที่สามารถคำนวนค่าได้จาก function
  3. User marco คือ macro ที่สามารถกำหนดชื่อ และค่าได้จากผู้ใช้งาน ซึ่งจะมีระดับในการกำหนดค่า (Level) ดังต่อไปนี้
    • Host level macro (ใช้งานก่อน)
    • Macro ที่ถูกำหนดไว้ใน 1'st level templates ของ host (พิจารณาใช้งานตามลำดับ link template), จากนั้นเรียงการใช้งานตามหมายเลข ID ของ template
    • Macros ที่ถูกำหนดไว้ใน 2'nd level templates ของ host, เรียงการใช้งานตามหมายเลข ID ของ template
    • ที่ถูกำหนดไว้ใน 3'rd level templates ของ host, รียงการใช้งานตามหมายเลข ID ของ template
    • Global macros (ใช้งานลำดับสุดท้าย)
      ตัวอย่างการสร้าง Macro (ระดับ Host)

Configuration -> Hosts -> [SELECTED HOST] -> Macro

โดยจะปรากฏหน้าจอ Create item  โดยใส่ข้อมูลดังนี้

  • Macro: QUERY  => คือชื่อของ macro (ใส่ให้ตรงกับพารามิเตอร์)
  • Value: SELECT COUNT(ID) FROM Product  => คือค่าของ macro นั้น ยกตัวอย่างต้องการทดสอบการ query ฐานข้อมูล จึงทำการใส่ SQL เข้าไป

*** โดยปกติจะไม่มีการใส่รหัสผ่าน (Password) ใน macro เพราะจะทำให้เห็นรหัสผ่าน วิธีการที่แนะนำคือการทำ mapping ระหว่าง host และรหัสผ่านใน script แทน***


ทำความรู้จักกับ Zabbix External Script
    Zabbix External Script คือการเขียน script เพื่อเติมเพื่อให้สามารถทำการ monitor ได้ตามที่ต้องการอย่างไม่มีขอบเขต เนื่องจากเป็นการเขียนโปรแกรมเพื่อทำการ monitor ซึ่งสามารถเขียนได้ทั้งจาก Shell Script, ภาษา Python, ภาษา Perl และภาษาอื่นๆ ที่เครื่อง Zabbix สามารถ execute ได้
   ซึ่งความคิดเป็นส่วนตัว การใช้งาน external script นั้นมีแนวทางการใช้งานดังนี้

  1. ข้อมูล Input กำหนด (ได้มาจากการสั่งจาก Zabbix ที่มี macros)
  2. การดำเนินการใน Script (จะดูรายละเอียดในตัวอย่างโปรแกรม)
  3. ผลที่ได้จากการตรวจสอบ return value โดยมีตัวเลขในการส่งผลดังนี้
    • ถ้า Return Response time ที่ได้จากการทำงาน ตั่งแต่ 0 เป็นในทางบวก นั่นหมายถึงระบบทำงานได้ (ขึ้นอยู่ว่าจะทำงานได้เร็วหรือช้า)
    • ถ้า Return เป็น -1 จะหมายถึงระบบทำงานไม่ได้/มีปัญหา

   สำหรับโปรแกรม script นั้น โดยปกติจะอยู่ที่ไดเร็กทอรี /etc/zabbix/externalscripts ซึ่งจากตัวอย่างการกำหนดใน Item ในส่วนของ Key มีรายละเอียดดังนี้

mssqlchk.py["{HOST.CONN}","{DBQUERY}","{DBUSER}","{DBPASS}","{DBNAME}"]

   การ mapping parameters

    • {HOST.CONN} <--> sys.argv[1]
    • {DBQUERY} <--> sys.argv[2]
    • {DBUSER} <--> sys.argv[3]
    • {DBPASS} <--> sys.argv[4]
    • {DBNAME} <--> sys.argv[5]


  • สร้างไฟล์ script ชื่อ mssqlchk.py (**ต้องกำหนด permission ใน OS  ให้ผู้ใช้งานชื่อ zabbix สามารถ execute ไฟล์นี้ได้, chown zabbix mssqlchk.py; chmod 500 mssqlchk.py **

และในไฟล์ สามารถเขียนโปรแกรมให้ทำงานได้ดังนี้ (ตัวอย่างภาษา Python)

#!/usr/bin/python
import pymssql #import module pymssql เพื่อ connection ไปยังฐานข้อมูล
          import sys #import module sys เพื่อรับ parameter จาก command line
import time  #import module time เพื่อใช้จับเวลา
try: #ขึ้นตอนคำสั่ง except 
   start = int(round(time.time() * 1000)) #ดูเวลาเริ่ม script
   db = pymssql.connect(sys.argv[1], sys.argv[3], sys.argv[4], sys.argv[1]) #connection to database
   cursor = db.cursor()
   sql = sys.argv[2] #คำสั่ง SQL
   cursor.execute(sql) #ทำการ Query database
   results = cursor.fetchall()
   db.close()
   end = int(round(time.time() * 1000)) #ดูเวลาจบการรัน script
   time = end-start #ให้ time=end-start แล้วส่งเป็นค่า time เวลาหน่วยเป็น ms
   print int(time)
except pymssql.OperationalError: #ถ้าเกิด Error หรือรัน Script ไม่ผ่านให้ส่ง -1
   print int(-1)

   จากนั้นสามารถทดสอบค่าที่ได้จาก script โดยการตรวจสอบที่ Latest Data เมื่อการทำงานถูกต้องสามารถดำเนินการสร้าง Graph และ Trigger เพื่อใช้งานได้ต่อไป รวมไปถึงสามารถเขียนโปรแกรมดึงข้อมูลตัวเลขอื่นๆ ตามที่เซอร์วิสนั้นมีให้ดำเนินการได้


ตัวอย่าง script อื่นๆ
   Script สำหรับตรวจสอบ Website
#!/usr/bin/python
import sys  #import module sys เพื่อใช้รับข้อมูลจาก Parameter
import time  #import module time เพื่อใช้นับเวลา
import urllib2  #import module urllib2 ใช้ในการเรียกค่าจากหน้าเว็บ
try: #ขึ้นตอนคำสั่ง except
   s = int(round(time.time() * 1000))  #ดูเวลาเริ่ม script
   url = sys.argv[1] #รับค่าจาก parameter ที่1 เข้าตัวแปร url
   response = urllib2.urlopen(url) #เปิดหน้าเว็บ
   webContent = response.read() #อ่านค่าจะหน้าเว็บ
   e = int(round(time.time() * 1000)) #ดูเวลาจบการรัน script
   find = webContent.find(sys.argv[2]) #ค้นหา คำตาม Key ที่ใส่มาใน Parameter ที่ 2
   if  find < 0: #ถ้าคนหาได้ น้อยกว่า 0 คำ ให้ส่งเป็น -1
           t = -1
           print int(t)
   else: #นอกนั้นให้ t=e-s แล้วส่งเป็นค่า t เวลาหน่วยเป็น ms
           t = e-s
           print int(t)
except urllib2.URLError: #ถ้าเกิด Error หรือรัน Script ไม่ผ่านให้ส่ง -1
   print int(-1)


   Script สำหรับตรวจสอบ DNS
#!/usr/bin/python
import time  #import module time เพื่อใช้นับเวลา
import sys
import socket #import module socket ตรวจสอบ DNS
start = int(round(time.time()*1000)) #ดูเวลาเริ่ม script
name = sys.argv[1]  #ชื่อ DNS
try: #ขึ้นตอนคำสั่ง except
    host = socket.gethostbyname(name)  #ตรวจสอบชื่อ DNS ว่าเป็น IP อะไรถ้า DNS ทราบถือว่าใช้ได้
    end = int(round(time.time()*1000)) #ดูเวลาจบ script
    time = end-start #ให้ time=end-start แล้วส่งเป็นค่า time เวลาหน่วยเป็น ms
    print int(time)
except socket.gaierror, err: #ถ้าไม่สามารถถาม IP จาก DNS ได้จะเกิด socket.gaierror จะส่งค่าเป็น -1
    print int(-1)


   Script สำหรับตรวจสอบ Oracle
#!/usr/bin/python
import cx_Oracle #import module cx_Oracle เพื่อ connection ไปหา database
import sys
import time  #import module time เพื่อใช้นับเวลา
try: #ขึ้นตอนคำสั่ง except
   start = int(round(time.time() * 1000)) #ดูเวลาเริ่ม script
   connection = cx_Oracle.connect(sys.argv[1]) #connection string to database
   cursor = connection.cursor()
   sql = sys.argv[2] #คำสั่ง SQL
   cursor.execute(sql) #ทำการ Query database
   count = cursor.fetchall()
   connection.close()
   end = int(round(time.time() * 1000)) #ดูเวลาจบการรัน script
   time = end-start #ให้ time=end-start แล้วส่งเป็นค่า time เวลาหน่วยเป็น ms
   print int(time)
except pymssql.OperationalError: #ถ้าเกิด Error หรือรัน Script ไม่ผ่านให้ส่ง -1
   print int(-1)


   Script สำหรับตรวจสอบ LDAP
#!/usr/bin/perl
use Net::LDAP;
use Time::HiRes qw( gettimeofday tv_interval );
     
my $chkSuccess = 0;
my $ldapserver = "LDAPSERVERIP";
my $ldapversion = 2;
my $ldapuser = "cn=ldadm,o=test";
my $ldapbase = "uniqueId=lduser1,ou=local,deptName=it,o=users,o=TESTER";
my $ldappass = "pass123";
my $searchstring = "objectclass=*";
my @attribs = ('uniqueID');
sub LDAPsearch {
my ($ldap,$searchString,$attrs,$base) = @_;
my $result = $ldap->search ( base => "$base",
scope => "base",
filter => "$searchString",
attrs   =>  $attrs
);
}
my $t0 = [gettimeofday];
my $ldap = Net::LDAP->new ($ldapserver) or die ("-1\n");
$ldap->bind ($ldapuser, password => $ldappass, version => $ldapversion) or die ("-1\n");
my $search = LDAPsearch ($ldap, $searchstring, \@attribs, $ldapbase ) or die ("-1\n");
my @entries = $search->entries;
my ($uniqueID);

if (@entries) {
$uniqueID=$entries[0]->get_value('uniqueID');
if ($uniqueID=="lduser1") {
$chkSuccess = 1;
} else {
$chkSuccess = 0;
} } else {
$chkSuccess = 0;
}

$ldap->unbind;
my $elapsed = tv_interval ($t0, [gettimeofday]);
if($chkSuccess==1) {
        print $elapsed;
} else {
        print "-1";
}


Script สำหรับตรวจสอบ TACACS
#!/usr/bin/perl
use Net::TacacsPlus::Client;
use Net::TacacsPlus::Constants;
use Time::HiRes qw( gettimeofday tv_interval );
     
my $chkSuccess = 0;
my $tac = new Net::TacacsPlus::Client(
        host => 'TACACSSERVERIP',
        key => 'tacacskey');
     
my $t0 = [gettimeofday];
if ($tac->authenticate('tuser1', 'tuser1passwd', TAC_PLUS_AUTHEN_TYPE_PAP)){                

        #print "Authentication successful.\n";                                
        $chkSuccess = 1;
} else {                                                  
        #print "Authentication failed: ".$tac->errmsg()."\n";      
        $chkSuccess = 0;
}                                                        
my @args = ('service=junos-exec', 'local-user-name=staff');
my @args_response;
if($tac->authorize('tuser1', \@args, \@args_response))
{
        #print "Authorization successful.\n";
        #print "Arguments received from server:\n";
        #print join("\n", @args_response);
        $chkSuccess = 1;
} else {
        #print "Authorization failed: " . $tac->errmsg() . "\n";
        $chkSuccess = 0;
}
my $elapsed = tv_interval ($t0, [gettimeofday]);
if($chkSuccess==1) {
        print $elapsed;
} else {
        print "-1";
}


Script สำหรับตรวจสอบ Radius
#!/usr/bin/perl
use Authen::Radius;
use Time::HiRes qw( gettimeofday tv_interval );
     
my $chkSuccess = 0;
my $host = "RADUISSERVERIP";
my $port = 1812;
my $username = "ruser1";
my $password = "ruser1passwd";
my $secret = "secret";
my $nas = "192.168.99.100";
my $timeout = 5;
my $t0 = [gettimeofday];
$host = "$host:$port" if $port;
if (!(my $radius = Authen::Radius->new(Host => $host, Secret => $secret, TimeOut => $timeout))){
    my $err = "Could not connect to $host";
    $err .= ": " . Authen::Radius::strerror if (Authen::Radius::strerror);
    print $err, "\n";
    $status = &set_status(0);
}else{
    my $answer = $radius->check_pwd($username, $password, $nas);
$status = &set_status($answer);
print $status;
}
my $elapsed = tv_interval ($t0, [gettimeofday]);
if($chkSuccess==1) {
        print $elapsed;
} else {
        print "-1";
}
sub set_status {
    my $res = shift;
    my $status;
    if ($res) {
$status = "OK";
    }else {
$status = "CRITICAL";
    }
    print "$status\n";
    return($status);
}

Share:

CPU Load คืออะไร แตกต่างกับ CPU Usage % อย่างไร.....แล้วทำไม zabbix template จึงไม่ทำ CPU Usage


💢 เรามาทำความเข้าใจสองค่านี้กันก่อนนะครับ 💢

สมมุติว่าเครื่องเรามี 1 CPU (1 core)
มีงานรันจนใช้ CPU Usage = 100% พอดีเป๊ะๆ ใน OS (operating system) จะเห็นว่า CPU Load = 1
ลักษณะแบบนี้ใช้ CPU เป๊ะ จะไม่มีงานรอนะครับ
ทีนี้มีงานเพิ่มอีกเท่าตัว เราก็เห็น CPU Usage = 100% เหมือนเดิมครับแต่ CPU Load = 2
ลักษณะแบบนี้คือเริ่มทำงานไม่ทันแล้วครับจะมีการรอเกิดขึ้น
แต่ก็มี Program บางประเภทครับ ที่ขอให้ CPU ไปใช้เพื่อรอ disk network ... I/O อื่นๆ
แบบนี้ CPU Usage อาจจะไม่ถึง 100% ครับ แต่ CPU Load = 2,3,4,5...💀

คราวนี้เรามาลองดูว่าถ้าเรามี 2 CPU (2 cores)
มีงานรันจนใช้ CPU Usage = 100% พอดีเป๊ะๆ ใน OS (operating system) จะเห็นว่า CPU Load = 2
ถ้าเรามี 3 CPU (3 cores)
มีงานรันจนใช้ CPU Usage = 100% พอดีเป๊ะๆ ใน OS (operating system) จะเห็นว่า CPU Load = 3

จะเห็นได้ว่า CPU 100% คือ OS มันมองว่าใช้งานคุ้มค่าครับ อยู่ที่ลักษณะโปรแกรมที่รันมากกว่าครับ
ด้วยเหตุผลนี้เราจึงใช้ในแง่ Capacity เพื่อใช้ในการ Planning

เรากลับมาดูที่ Zabbix ที่พวกเรากำลังศึกษากันนะครับ

 💛"Zabbix is an open source monitoring software - Zabbix on Wikipedia."💛 

ใช่แล้วครับ จุดประสงค์ของมันคือ Monitor ดึงนั้นการที่ CPU 100% ไม่ได้แสดงว่าระบบมีปัญหาเสมอไปครับ

แล้วค่า CPU Load เท่าไหร่ล่ะที่เหมาะสม
คำตอบคือ ไม่ตายตัวครับมีหลายปัจจัย
จำนวน Core, Program, Agreement ของ Software ที่เรากำหนดกับ User
Template ปรกติจะ set แค่ 5 ซึ่งเค้ามองแล้วว่างานสมัยนี้ไม่ค่อยมีเครื่องที่เป็น Physical ใหญ่ๆมี core เยอะๆครับ เป็น DevOps มากขึ้น
เราต้องคุยและทำ Test กับ User และ คนที่ทำ Application แล้ววัดผลร่วมกันครับว่าค่าไหนที่ยอมรับได้
ซึ่งปรกติที่ผมทำคือใช้ Default นี่แหละครับแล้วถ้าเครื่องไหนที่ปรกติ Load เยอะ แต่ยังใช้งานได้เร็วอยู่ก็ค่อยเพิ่ม Threshold ไปครับ


สำหรับใครต้องการจะ set graph cpu usage ไว้ใช้ดูนะครับลองดูค่านี้ครับ

system.cpu.util[,idle] <===== ค่านี้คือ idle เราก็ เอา 100 ลบเอาครับ


โชคดีครับ
😃😃😃😃😃


Share:

การ Access mysql/mariadb Server ด้วย Zabbix agent ในขณะที่เปิด SELinux (CentOS)

เนื่องจากผมได้ศึกษาบทความของพี่ Krit
https://zabbix-in-thailand.blogspot.com/2018/11/zabbix-server-selinux-how-to-add-policy.html

ทำให้ใช้งาน Zabbix Server ในขณะที่เปิด SELinux ได้ แต่ยังติดปัญหาเรื่อง Agent ไม่สามารถ Access (Local Access)ไปยัง mysql/mariadb Server ได้  จึงต้องทำการ add policy selinux ดังนี้

1.Create file ชื่อ zabbix_mysql.te


module zabbix_mysql 1.0;
require {
        type unconfined_t;
        type mysqld_var_run_t;
        type mysqld_etc_t;
        type mysqld_t;
        type zabbix_var_lib_t;
        type zabbix_agent_t;
        class sock_file write;
        class unix_stream_socket connectto;
        class file { read relabelto open };
        class dir relabelto;
}

#============= unconfined_t ==============
allow unconfined_t zabbix_agent_t:dir relabelto;
allow unconfined_t zabbix_agent_t:file relabelto;

#============= zabbix_agent_t ==============
allow zabbix_agent_t mysqld_etc_t:file { read open };
#!!!! This avc can be allowed using the boolean 'daemons_enable_cluster_mode'
allow zabbix_agent_t mysqld_t:unix_stream_socket connectto;
allow zabbix_agent_t mysqld_var_run_t:sock_file write;
allow zabbix_agent_t zabbix_var_lib_t:file { read open };

2.Run Command ตามนี้


checkmodule -M -m -o zabbix_mysql.mod zabbix_mysql.te

semodule_package -o zabbix_mysql.pp -m zabbix_mysql.mod

semodule -i zabbix_mysql.pp

3.Restart zabbix_agent  ก็สามารถ Access mysql/mariadb ที่เครื่องตัวเองได้แล้วครับ ถ้า Add Template DB MySQL เอาไว้ก่อนแล้ว ก็จะเห็นว่าสมารถดูข้อมูลได้แล้วครับ


Reference: https://support.zabbix.com/browse/ZBX-10782
Share:

How to monitoring tcp port on zabbix

Zabbix นั้นเป็น Monitoring ที่สามารถ Monitor ได้เกือบทุกอุปกกรณ์ไม่ว่าจะเป็น Server Switch หรือแม้กระทั้งอุปกรณ์ต่างๆที่ทำงานอยู่บนเครือข่ายเราก็สามารถใช้ Zabbix Monitor ได้ วันนี้ผมจะมาแนะนำวิธีการ Monitor tcp port โดยใช้ Zabbix ต้องบอกก่อนว่า Service บางตัวบน Linux นั้นสามารถกำหนดได้หลายๆ Port อย่างเช่น Nginx เป็นต้นซึ่งในบางสถานการณ์ Service อาจจะยังมีสถานะ On อยู่แต่ Port บาง Port ได้ Down ไปแล้วซึ่งเราไม่สามารถรู้ได้เลยถ้าหากเราไม่ได้ Monitor Port ไว้

1. เข้าไปหน้า Configuration > Host > Item  จากนั้นให้สร้าง Item ใหม่


2. ตั้งค่าต่างๆในหน้าสร้าง Item


ให้สังเกตุตรงที่หัวข้อ Key ให้เรากดที่ Select เพื่อเลือก Parameter ที่เราจะนำมาใช้ Monitor ซึ่ง Parameter ที่เราจะนำมาใช้ Monitor port tcp นั้นก็คือ  net.tcp.listen[port]


เมื่อเลือก Parameter เสร็จแล้วให้มาใส่ Port ที่ต้องการจะ Monitor ตามตัวอย่างดังภาพ


หลังจากนั้นก็กด Add ได้เลย เมื่อเราได้สร้าง Item เสร็จแล้วหลังจากนั้นให้เรามาสร้าง Trigger ด้วยเพื่อที่จะได้มีการแจ้งเตือนเมื่อ Port นั้น Down ไป


3. ตรงหน้าสร้าง Trigger ให้ตั้งชื่อ Trigger และกำหนด Serverity ให้เรียบร้อยจากนั้นมาดูตรงหัวข้อ Expression  ให้เรากด Add เพื่อเลือก Item ที่เราสร้างไว้ก่อนหน้านี้


เมื่อกำหนดรายละเอียดครบหมดแล้วจากนั้นให้กด Add ได้เลย
ตัวอย่าง Trigger การแจ้งเตือนเมื่อ Port ที่เราตั้งค่าไว้ Down


Writen by system747


Share:

Auto Service Recovery for Windows OS with Remote Execute Command from Zabbix Agent


การ Monitor Host ปกติ หากเกิด Trigger Alarm ขึ้น Zabbix ก็แค่แสดง Alarm ให้เราดูว่าเกิดอะไรขึ้นเท่านั้น แต่เราสามารถทำให้ Zabbix ดำเนินการอะไรบางอย่าง(Action) กับ Trigger นั้น แบบ Automatic ได้ มีวิธีการดังนี้

1.Enable Remote Command ที่ Zabbix Agent โดยแก้ไข Parameter ดังนี้
EnableRemoteCommands=1  


  Restart Service Zabbix Agent
 

2.ที่ Trigger (หรือ Trigger Prototype) กำหนด tags เป็น {#SERVICE.NAME}


เมื่อเกิด Trigger จะใส่ Tags ให้ตามชื่อ Service Name

3.เข้าไปที่ Configuration > Actions > Event Source เลือก Triggers > Create Action
 
4.ใส่ Condition โดยกำหนด  Trigger ที่เราต้องการ
5.ไปที่ Tab Operation เลือก new > Operation Type เลือก Remote Command > Command กำหนดค่าเป็น C:\Windows\System32\net start {EVENT.TAGS}

จากนั้นกด Save

**Macro {EVENT.TAGS} คือ value ที่ได้รับมาจาก {#SERVICE.NAME}  ใน Trigger 

ทำการทดสอบโดย Stop firewall service บน Windows 

 
หลังจากนั้น  Action log บน Zabbix จะ แสดง Message Remote Execute แปลว่า Command ทำงานแล้ว
 
เมื่อกลับไปดูที่ firewall service จะเห็นว่า กลับมา start เหมือนเดิม
 

By   Sathienpong Khunin
Share:
 
Zabbix in Thailand
Facebook Group · 701 members
Join Group
กลุ่มนี้จัดตั้งขึ้นเพื่อแลกเปลี่ยนความรู้ของ zabbix ใครมีคู่มือ เทคนิค หรือ ปัญหา มาร่วมมือกันแก้ไขกันสำหรับชาวไทย -----------------------------------...
 

Popular

ค้นหาบล็อกนี้

Labels

Comments

Labels

Recent Posts